REQUEST A QUOTE

3D Metrology Services – Tool & Die – Form Inspection & Comparison to CAD

At EDM Intelligent Solutions, our high-resolution 3D scans of piece parts allow for form measurement down to the µm scale. A form measurement is made by cutting profiles across the 3D part scan data set and those included points are used to gather various form dimensions including radii, angles, slot width, height step and more.

Our 3D Metrology solutions utilize automated comparisons of high-resolution 3D part scans against the original CAD model, as well as additional 3D scanning services for quick and accurate difference measurements. 3D scans of the piece part containing millions of data points are compared to ideal CAD models to verify dimensional accuracy of the entire part, or a specific feature. With our 3D Metrology Services, we’re able to offer our customers in-depth, non-contact measurements of almost any shape, size, and form.

Below is an example of a difference measurement and a form inspection of a miniature lens housing. This is a four step process. The difference evaluation, form inspection, and 3D measurements of this component were completed using our MVi5 3D Metrology Center.


APPLICATION DETAILS

  • Component – Precision Die Insert
  • Material – Hardened Tool Steel
  • Metrology Services:
    • Difference Measurement
    • Form Inspection

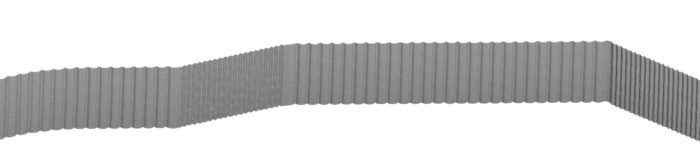
Step1: Capture 4mm Wide Scan

A close-up, top-down view of a gray, corrugated tube or hose against a white background. The tube has a flexible, accordion-like structure with regular vertical pleats. It appears to be slightly curved, with a narrower section on the left transitioning to a wider section on the right, and then tapering off again.

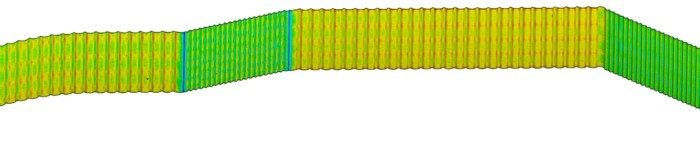
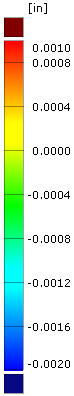
Step 2: 3D Comparison to CAD

A detailed visualization displays a corrugated pipe, possibly representing stress or flow distribution, with a color gradient transitioning from yellow and red on the left to green and blue on the right. The pipe appears to change diameter, narrowing towards the right side of the image. The corrugations are clearly defined, suggesting a structural or fluid dynamics analysis.A color bar legend shows a range of values in inches, from 0.0010 at the top to -0.0020 at the bottom. The color gradient transitions from dark red, through orange, yellow, green, cyan, and finally to dark blue, indicating a scale for a physical measurement. This type of legend is commonly used in scientific and engineering visualizations to represent data distribution or magnitude.

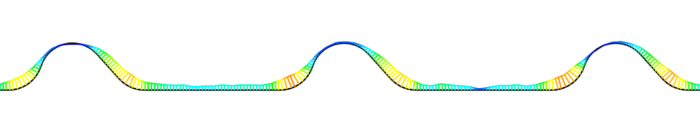
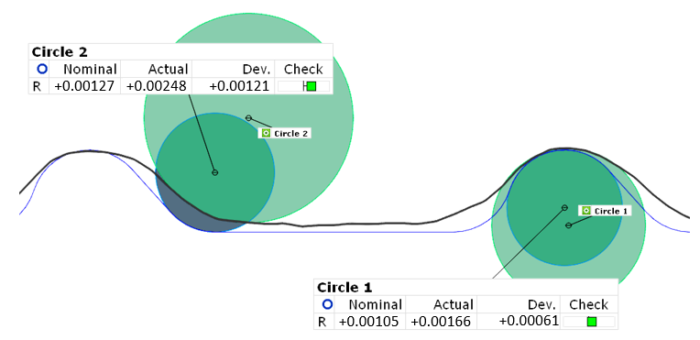
Step 3: Profile Comparison to CAD

A black line forms a series of smooth, rounded peaks and valleys, representing a baseline or ideal waveform. Overlayed on this is a slightly jagged blue line that closely follows the black line, but with minor deviations, suggesting a real-world measurement or a modified version of the original signal. The overall impression is a comparison between a theoretical or perfect curve and an actual, imperfect one, possibly illustrating signal processing, data analysis, or a comparison of two related phenomena.

A visualization of a roller coaster track with multiple hills and dips, rendered with a color gradient from blue to green to yellow to red, indicating varying levels of stress or force along the track.This image displays a color bar legend, likely from a scientific or engineering simulation, indicating a range of values in inches. The color gradient transitions from dark red at the top, representing the highest positive values (0.0010 inches), through yellow and green (around 0.0000 inches), to dark blue at the bottom, signifying the lowest negative values (-0.0020 inches). This type of legend is commonly used to visualize scalar quantities such as displacement, stress, or strain across a model.

Step 4: Extract Measurements

This image displays a geometric analysis of two circles, labeled 'Circle 1' and 'Circle 2', against a wavy black and blue line. For each circle, the nominal radius, actual radius, and deviation are provided. Circle 2 has a nominal radius of +0.00127 and an actual radius of +0.00248, resulting in a deviation of +0.00121. Circle 1 has a nominal radius of +0.00105 and an actual radius of +0.00166, with a deviation of +0.00061. Both circles are visualized with their nominal (lighter green) and actual (darker green) extents, indicating a discrepancy between the intended and measured sizes. The wavy lines likely represent a profile or contour being measured against these circular references.


COMPETITIVE 3D METROLOGY, MEASUREMENT, AND INSPECTION SERVICES

Intelligent solutions to manufacturing and measurement challenges are what we do. Over the past 25 years, we’ve completed thousands of measurement and metrology projects. What differentiates EDM Intelligent Solutions 3D Metrology services from the competition is our unique understanding of each manufacturing process. The EDMIS metrology technicians and applications engineers support their colleagues in our tight tolerance CNC machine shop that produces ultra-precision components for customers every day. Harnessing this unique relationship with manufacturing, our metrology team has the experience needed to fully assist our customers leverage the measurements taken of their components to improve their manufacturing processes. We are confident that we can measure your most challenging components and work with you to fully understand what those measurements tell you about them. To learn more about how EDMIS can help you, contact our metrology team with your request for quote.