REQUEST A QUOTE

3D Metrology Services Petoskey, MI

INDUSTRIAL 3D DIMENSIONAL METROLOGY AND INSPECTION COMPANY PETOSKEY, MI

Slide

EDM Intelligent Solutions – 3D Metrology Services Group Serving Petoskey, MI

The metrology group at EDM Intelligent Solutions (EDMIS) provides in-depth, non-contact 3D dimensional metrology and dimensional inspection services for parts of almost any shape and size. 3D measurement of form, surface roughness and comparison to nominal CAD models allow us to provide our clients with advanced GD&T inspection services and enhanced 3D roughness parameters for even the most complex components. Our dimensional measurement laboratory and surface roughness testing lab offer both contract and outsource metrology and measurement services.


3D Metrology Company Supporting Industries Across the Globe

3D Metrology Services from EDM Intelligent Solutions are trusted to support OEM customers and manufacturing service providers within the major Aerospace, Automotive, Communications, Defense, Medical and Scientific industries. EDMIS is the source for 3D Metrology Services serving Petoskey, Michigan including Form Measurement, Difference Measurement, and Surface Roughness Measurement.


High-Resolution Non-Contact Industrial 3D Metrology Services

Our contract inspection and contract measurement services include the following:

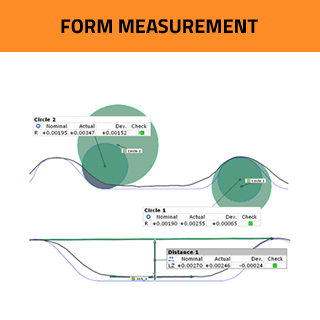
Form Measurement – High resolution 3D scans of piece parts allow for form measurement down to the µm scale. Profiles are cut across the 3D part scan data set and those included points are used to gather various form measurements including radii, angles, slot width, height step, etc.…

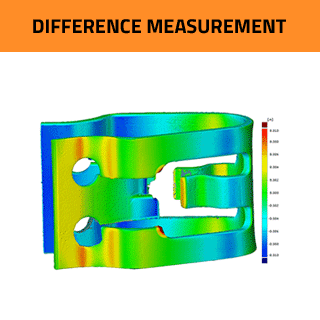
Difference Measurement – 3D scans of the piece part containing millions of data points are compared to ideal CAD models to verify dimensional accuracy of the entire part, or a specific feature.

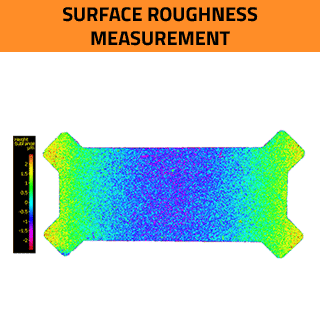
Surface Roughness Measurement – non-contact, high-resolution profile and area-based roughness measurement of surfaces down to 1.2 µinches. Our 3D inspection technology is capable of measuring the surface roughness of almost any material, including metals, ceramics, and plastics.

To learn more about how EDMIS can help you measure your components, contact our metrology team with your request for quote.

3D METROLOGY SERVICES AND CAPABILITIES

It is difficult to think of an application that cannot benefit from highly accurate and repeatable measurement solutions. Utilizing cutting edge 3D metrology scanners and automation, we offer in-depth, non-contact 3D dimensional metrology and inspection services for parts of almost any shape and size. Instant measurement of form, surface roughness and comparison to nominal CAD models allow EDMIS to provide our clients with quick access to advanced GD&T inspection services and enhanced 3D surface roughness testing for even the most complex components. OEM customers and manufacturing service providers within the major Aerospace, Automotive, Communications, Defense, Medical and Scientific industries worldwide have come to trust and rely on the insight that is gained from having high-resolution 3D scans and measurements taken of their parts. This deep knowledge into the physical characteristics of the parts coming out of a production process allows our customers’ engineering teams to improve their manufacturing processes, reduce waste and increase overall part quality. When used as on-demand measurement, the 3D metrology services at EDMIS bolster quality control and assurance teams instantly by giving them an easy way to scale up their measurement capacity when demand is too great for internal resources.


OUR CAPABILITIES AND KNOWLEDGE REACH BEYOND STANDARD MEASUREMENT SERVICES

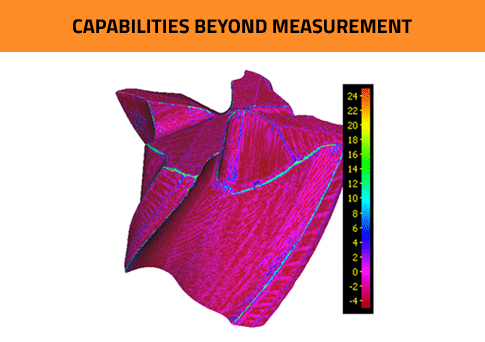
Measurement of components is just one step in taking full advantage of the benefits that 3D metrology offer our customers. Understanding how the measurements of specific features and characteristics of customer’s components paints a complete picture of how a both part designs and manufacturing processes are performing. Drawing on this insight, customers are empowered to improve engineering designs and manufacturing processes to produce higher quality parts with increased efficiencies and reduced waste.


Process Development

  • Design for performance
  • Design for efficiency
  • Design for manufacturing

Production

  • Part integrity
  • Process monitoring
  • Process improvement

Quality

  • Design intent verification
  • Gage R&R
  • MSA
  • Form Inspection
  • Surface Roughness Measurement
  • Process Capability Analysis

3D Metrology Services Reference Materials

EDM Intelligent Solutions has gathered the reference materials below to help customers better understand specific metrology terminology that is related to the 3D Metrology Services that we offer. Much of this information can also be found within various documents from the International Standards Organization that are published as specific ISO standards like ISO 4287, ISO 10725, etc….

SURFACE ROUGHNESS PARAMETERS
This section explains the main parameters of ISO 4287. Each parameter is classified according to primary profile (P), roughness profile (R), and waviness profile (W) in order to evaluate different aspects of the profile. (When the wavelengths of the waviness and primary profile components are compared, the surface roughness component is the asperity component of that which has the comparatively shorter wavelength.)
Peaks and valleys in the height direction
Arithmetical mean height (Ra, Pa, Wa)
Maximum height of profile (Rz, Pz, Wz)
Maximum profile peak height (Rp, Pp, Wp)
Maximum profile valley depth (Rv, Pv, Wv)
Mean height of profile elements (Rc, Pc, Wc)
Total height of profile (Rt, Pt, Wt)
Average amplitude in the height direction Root mean square deviation (Rq, Pq, Wq)
Average characteristics in the height direction
Skewness (Rsk, Psk, Wsk)
Kurtosis (Rku, Pku, Wku)
Horizontal direction Mean width of the profile elements (RSm, PSm, WSm)
Hybrid Root mean square slope (RΔq, PΔq, WΔq)
Areal material ratio curve and probability density function
Load length ratio (Rmr (c), Pmr (c), Wmr (c))
Profile cut level difference (Rδc, Pδc, Wδc)
Relative load length ratio (Rmr, Pmr, Wmr)
Material ratio curve (BAC)
Probability density function (ADF)
Mean height of profile elements
(Rc, Pc, Wc)
Mean height of profile elements indicates the average value of the height of the curve element along the sampling length. Profile elements consist of a peak and a neighboring valley. The peaks (or valleys) that constitutes as an element have minimum height and length standards such that they will be treated as noise and considered a part of the preceding valley (or peak) if the height (or depth) is less than 10% of the maximum height or the length is less than 1% of the segment length.
Total height of profile
(Rt, Pt, Wt)
Total height of profile is the vertical distance between the maximum profile peak height and the maximum profile valley depth along the evaluation length.
Root mean square deviation
(Rq, Pq, Wq)
Root mean square deviation indicates the root mean square along the sampling length. For the roughness profile, Rq is referred to as the root-mean-square roughness, while Wq is referred to as root-mean-square waviness for the waviness profile.
Skewness
(Rsk, Psk, Wsk)
Skewness uses the cube of the root mean square deviation to display the dimensionless cube of the sampling length Z(x).
Kurtosis
(Rku, Pku, Wku)
Kurtosis uses the fourth power of the root mean square deviation to display the dimensionless fourth power of the sampling length Z(x).
Mean width of the profile elements
(RSm, PSm, WSm)
Mean width of the profile elements indicate the average value of the length of the profile element along the sampling length; Xsi is the length of a single profile element. The peaks (valley) that constitute elements have minimum height and length standards such that they will be treated as noise and considered a part of the preceding valley (peak) if the height (depth) is less than 10% of the maximum height or the length is less than 1% of the segment length.
Root mean square slope
(RΔq, PΔq, WΔq)
Root mean square slope indicates the root mean square of the local tilt dZ/dX along the sampling length.
Load length ratio
(Rmr (c), Pmr (c), Wmr (c))
Load length ratio (Zmr (c)) is the ratio of the load length Mr (c) of profile curve elements to the evaluation length at cut level c (height in % or μm Mil).
Profile cut level difference
(Rδc, Pδc, Wδc)
Profile cut level difference (Zδc) shows the cut level c difference of the height trends that agree with the two given load length ratios. 2 load length ratios, Zmr1 and Zmr2 (load %) must be specified.
Relative load length ratio
(Rmr, Pmr, Wmr)
Relative load length ratio (Zmr) shows the load length ratio determined by a reference load length ratio (Zmr0) and the cut level difference (Zδc) from the cut level corresponding to the reference load length ratio. Reference load length ratio Zmr0 (% load) and cut level difference ZΔc (height in % or mm inch) must be specified.
Material ratio curve
(BAC)
Material ratio curve shows the curve of load length ratio determined as the cut level c function. Load length ratio is the ratio (%) obtained by dividing the total lengths of the length of curve data exceeding the cut level by the entire length (rn).
Probability density function
(ADF)
ADF displays the probability of height Z(x) obtained across the evaluation length. The derivative of the BAC data is also determined. These derivatives use the three-point formula shown below. When n=0 or N, calculations are carried out with BAC (-1) = 0.0 and BAC (N+1) = 100.0. Because the vertical range is the same as BAC, this is shown on the same graph. However, the graph is automatically adjusted so that the maximum value on the horizontal is 80%.
REFERENCES TO STANDARD ISO 17025 FOR SURFACE AREA MEASUREMENTS
Height
Sk arithmetical mean height
Sz maximum height
Sq root mean square height
Ssk skewness
Sku kurtosis
Sp maximum peak height
Sv maximum pit height
Spatial
Sal auto-correlation length
Str texture aspect ratio
Std* texture direction
HYBRID
Sdq root mean square gradient
Sdr developed interfacial area ratio
FUNCTIONAL
Smr(c) areal material ratio
Smc(mr) inverse areal material ratio
Sk core roughness depth
Spk reduced peak height
Svk reduced dale height
Smr peak material portion
Smr2 valley material portion (% of the measurement area that compromises the deeper valley structures associated with Svk)
Sxp peak extreme height
FUNCTIONAL VOLUME
Vvv dale void volume
Vvc core void volume
Vmp peak material volume
Vmc core material volume
FEATURE
Spd density of peaks
Spc arithmetic mean peak curvature
S10z / S5p / S5v / Sda(c) / Sha(c) / Sdv(c) / Shv(c)
SURFACE ROUGHNESS TERMINOLOGY
This section explains the terms used in ISO 25178 Surface Texture
Angular spectrum (graph) The angular spectrum indicates a graph for determining the direction of the lay (or surface pattern; hairline, in the case of metal) comprising a surface.
Auto-correlation function Auto-correlation function is used to evaluate the periodicity of surface roughness in the direction of the plane.
Course line Curve separating adjacent hills
Dale Region around a pit such that all maximal downward paths end at the pit
Definition area Definition area is the portion of the evaluation area that is used for parameter definition.
Evaluation area Evaluation area is the portion of the scale-limited surface that is subject to evaluation.
F-operator F-operator removes form from the primary surface. This filter is equivalent to tilt correction, suppressing the nominal surface texture characterization.
Height The height represents the distance between the reference surface and each point on the scale-limited surface. A point lower than the reference plane has a negative value.
Hill Region around a peak such that all maximal upward paths end at the peak
L-filter L-filter is a filter eliminating the largest scale elements from the surface (high-pass filter). This filter is used to remove undulation and other lateral components from the surface, and thus allows for the extraction of only the roughness components. L-filter is equivalent to the cutoff value λc in JIS B 0633-2001.
Local peak height Height difference between the peak and its nearest saddle point connected by ridge line
Local pit height Height difference between the pit and its nearest saddle point connected by course line
Peak Point on the surface that is higher than all other points within a neighborhood of that point
Pit Point on the surface that is lower than all other points within a neighborhood of that point
Primary surface Primary surface is the surface obtained after S-filtering the real surface.
Real surface Real surface indicates the surface constituted from measurement data in the XY plane direction. Generally, the height data is the subject of processing.
Reference surface Reference surface is the base for the scale-limited surface, and represents the plane at the mean height of the evaluation area as per the ISO 25178 Surface Texture function.
Ridge line Curve separating adjacent dales
S-filter S-filter is a filter eliminating the smallest scale elements from the surface (low-pass filter). This filter is equivalent to the cutoff value λs in JIS B 0601-2001. In the case of contact-type surface roughness measurement, noise attributable to edge shapes is removed.
S-F surface Surface filter is a surface obtained after applying an F-operator to the primary surface.
S-L surface S-L surface is a surface obtained after applying an L-filter to the S-F surface.
Saddle point Point at which the ridge lines and course line cross
Scale-limited surface Scale-limited surface means either the S-F surface or the S-L surface. It is the equivalent of the roughness profile or waviness profile in the profile method.
Surface filter Surface filter is a filtration operator applied to a surface.

SERVICES PROVIDED FOR 3D DIMENSIONAL METROLOGY AND INSPECTION

Form Measurement
Difference Measurement
Surface Roughness Measurement
Capabilities Beyond Measurement
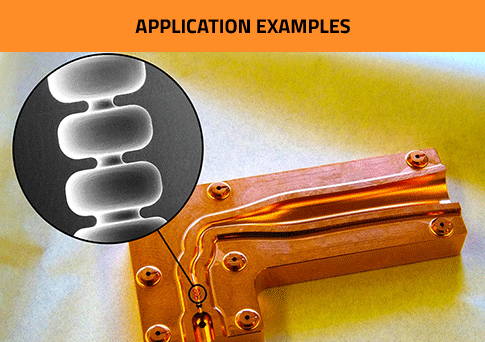
3D Metrology Application Examples

Competitive 3D Metrology, Measurement, and Inspection Services

Intelligent solutions to manufacturing and measurement challenges are what we do. Over the past 25 years, we’ve completed thousands of measurement and metrology projects. What differentiates EDM Intelligent Solutions 3D Metrology services from the competition is our unique understanding of each manufacturing process. The EDMIS metrology technicians and applications engineers support their colleagues in our tight tolerance CNC machine shop that produces ultra-precision components for customers every day. Harnessing this unique relationship with manufacturing, our metrology team has the experience needed to fully assist our customers leverage the measurements taken of their components to improve their manufacturing processes. We are confident that we can measure your most challenging components and work with you to fully understand what those measurements tell you about them. To learn more about how EDMIS can help you, contact our metrology team with your request for quote.